

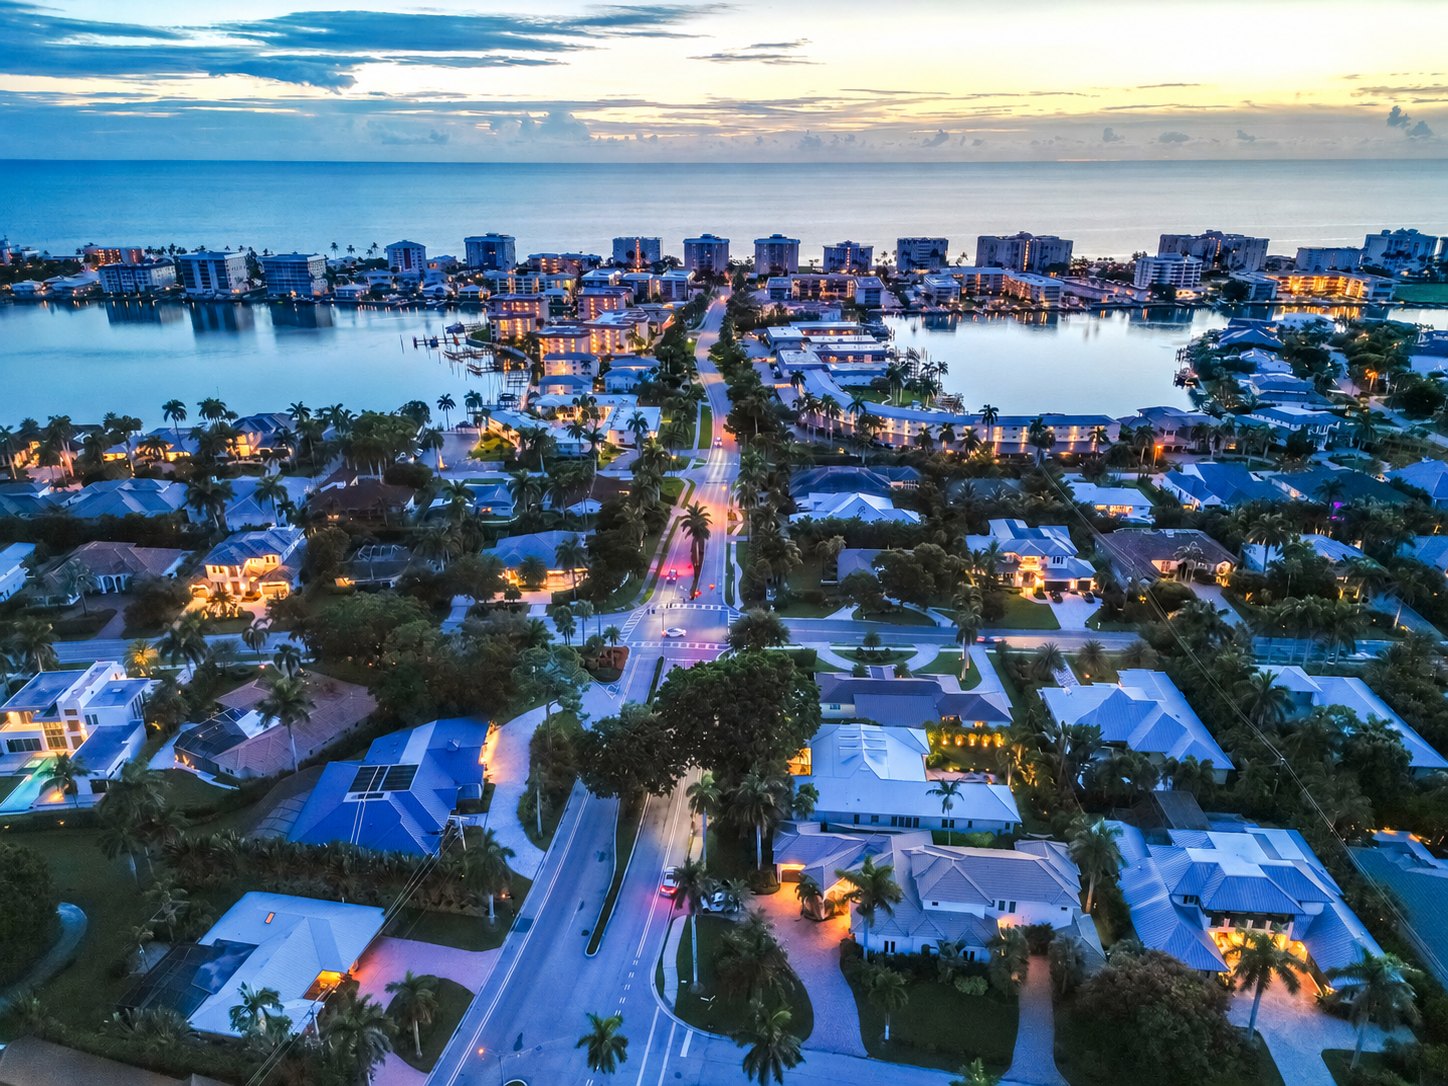
The Moorings Market Report
Every single family sale in The Moorings over the past 12 months, read straight from the MLS: what sold, how fast, how close to asking, and what is for sale now.
Closed sales October 20, 2025 to October 19, 2026, compared with the 12 months before. Active and pending counts as of October 19, 2026.
The gap between asking and selling is where strategy shows.
On average, Moorings homes closed at 92% of their final asking price. On a $5 million home, that difference is about $400,000.
That gap is not fixed. 10 homes sold within 30 days of listing, while 13 took more than 6 months. The difference was rarely the house alone. It was the price it started at and how it was presented to buyers in its first weeks.
32 of the 56 sales closed above $5 million, up from 18 the year before. Buyers are paying for The Moorings. The owners who capture it are the ones who price and present with the data in hand.
How The Moorings market has moved
33 of the 56 sales closed between January and May. Season decides the year here.
Homes sold each month
October 2025 counts closings from the 20th; October 2026 counts closings through the 19th. Shaded months are January through May.
Year over year
| 12 months to | Sold | Volume | Median price | Median days | Of final ask |
|---|---|---|---|---|---|
| Oct 19, 2026 | 56 | $328.6M | $5.15M | 80 | 92.2% |
| Oct 19, 2025 | 49 | $258.7M | $4.00M | 125 | 91.5% |
| Oct 19, 2024 | 28 | $164.7M | $5.58M | 75 | 91.2% |
Median price moves with the mix of homes that sold in a given year, so read it alongside the price bands below rather than as appreciation.
For sale right now
| Homes for sale | 29 |
| Under contract | 13 |
| Months of supply | 6.2 |
| Highest sale, 12 months | $18.3M |
Months of supply is homes for sale divided by the average number of closings per month over the past year.
By price
| Sale price | Sold | Median price | Median days | Of final ask | For sale |
|---|---|---|---|---|---|
| Under $3M | 9 | $2.30M | 36 | 93.2% | 5 |
| $3M to $5M | 15 | $3.90M | 103 | 91.0% | 8 |
| $5M to $10M | 27 | $6.50M | 110 | 92.6% | 15 |
| $10M and above | 5 | $14.75M | 65 | 92.1% | 1 |
| All | 56 | $5.15M | 80 | 92.2% | 29 |
Above $10 million, 1 home is for sale against 5 sold in the past year.
Street by street
| Streets with 3+ sales | Sold | Median |
|---|---|---|
| Crayton Road | 9 | $4.65M |
| Mooring Line Drive | 6 | $4.50M |
| Binnacle Drive | 5 | $3.50M |
| Leeward Lane | 4 | $9.30M |
| Spring Line Drive | 4 | $8.24M |
| Wedge Drive | 4 | $5.68M |
| Bow Line Drive | 4 | $5.04M |
| Putter Point Drive | 3 | $5.50M |
The other 17 sales were spread across 14 streets.
A private pricing read for your home
Jozef prepares it himself, in writing, from the same MLS data behind this report.
- The recent sales closest to your home, street and size
- Where your home sits against what is for sale today
- A price range, and what would move it
Or call Jozef directly at 239.398.7884.

Jozef Maston
Jozef Maston's sales per SWFLA MLS, January 1, 2016 to October 19, 2026, as listing or buyer's agent; volume counts each side.
The Moorings real estate FAQ
How many homes sold in The Moorings this past year?
56 single family homes closed between October 20, 2025 and October 19, 2026, up from 49 the year before, for $328.6 million in total sales.
How close to asking price do Moorings homes sell?
On average, 92.2% of their final asking price over the past 12 months. 5 of the 56 sales closed at or above their final asking price.
How long does it take to sell a home in The Moorings?
The median was 80 days on market, down from 125 the year before. 10 homes sold within 30 days, and 13 took more than 6 months.
How many homes are for sale in The Moorings right now?
29 single family homes were for sale and 13 were under contract on October 19, 2026. At the past year's pace, that is about 6 months of supply.
When do most Moorings homes sell?
In season. 33 of the past year's 56 sales closed between January and May, with April the busiest month at 10 closings.
What is my Moorings home worth?
It depends on the sales closest to yours by street, lot, water and size. Request a private pricing read and Jozef will prepare one in writing.
Sources and method
Southwest Florida MLS, residential search, building design single family, development The Moorings, Naples. Closed sales from October 20, 2025 to October 19, 2026, compared with the two prior 12 month periods. Active and pending counts as of October 19, 2026. Percent of final asking price is total sale price divided by total final list price, excluding sold data entry records with no marketing time. Price bands use sale price. Street figures include only streets with 3 or more sales. Information deemed reliable but not guaranteed.